DevOps Tooling for Developers - we're so spoilt!
Last week I had a catchup meeting with a client about the progress of a platform I'm building for them, and showed them how the "devops" side of things works. Demoing it really struck me how insanely awesome all the tooling we have nowadays is, and also how much I take it for granted!
I tweeted about it, but quickly realised as I was writing the multi-tweet Twitter thread, that a blog post would be a better fit for what I was trying to say. So here it is!...
First, let's start by defining what I mean by the "devops side of things". It initially started off with me showing some Terraform work I'd been doing to deploy the Azure infrastructure in a repeatable manner across environments (dev, UAT, prod). Because both this, and code changes, are triggered by Git pushes - the demo/conversation then evolved into me showing them the whole workflow...
Ie...
- Briefly showing Git
- How pushing to Git triggers Azure DevOps Pipelines
- Deployment approval gateways, allowing acceptance at the click of a button of UAT->Prod staged deployment
- Traceability - ie. hyperlinks from Azure Board work-items (which I use as a ticketing system and backlog), to Git commits, deployments, etc.
- Terraform Infrastructure deployment
- Azure Application Insights
- Azure Dashboards
You don't have to be a big team
Before going into more detail about the above bullet-points, I want to point out that it's just me working on this client's project, and I only work for them 1 day each week. I'm a developer, and the main focus of my time is building the software, not the above-mentioned devopsy stuff. Luckily, you get a lot of the above mostly out of the box, and also at zero-cost for small teams! We're pretty spoilt as developers nowadays!
This isn't just about Microsoft stuff
I'm strongly aware that a lot of what I talk about in this post is Microsoft, and very Azure related. The reason for this is because I happen to use Azure DevOps for CI/CD and Azure for cloud hosting. The aim of this post isn't to market Microsoft products though, and all the technologies I mention have non-Microsoft alternatives - which I do also reference in places in this post. I talk about Terraform, which can just as easily deploy to AWS rather than Azure. There are other CI/CD solutions if you don't want to use Azure DevOps - eg. TeamCity, CircleCI, Jenkins, and others. There are other diagnostics solutions, which I also discuss below.
The point I'm trying to make in this post - is that it's struck me how amazing all this tech is that even one-man bands can leverage. And we have so much choice too!
Git -> Automated Builds and Deployment
It all starts at Git. Aim to keep everything in source-control. Obviously primarily this is your codebase, but should ideally also include your infrastructure and deployment setups. This means that you have the history of any changes you make to infrastructure and deployments in source-control alongside your code changes. For example, I mentioned I use Terraform - these files should be in source-control. Azure DevOps Pipelines supports YAML files, which should also be in source control. If you're using Docker, Kubernetes, etc - put the Dockerfiles, K8S YAML files, in source control. Try to avoid creating your infrastructure by clicking 'Create' in the Azure Portal (or whatever hosting platform you use), and assuming you'll remember how to recreate it in the future. You don't have to use Terraform, that's just my preference - you have ARM Templates if using Azure, Pulumi, or other options.
Then when pushing these changes, you can have automated processes take over the rest. You've probably heard the terms 'continuous integration' and 'continuous delivery'. This is what this refers to.
So pushing code changes, can kick off builds and deployments. Infrastructure file changes (in my case Terraform .tf files) can kick off infrastructure updates. Azure Pipelines YAML file changes, can update the deployment workflows (ie. how to build/deploy stuff automatically).
As you can see - Git really is the trigger point for things being built/deployed.
Traceability
I touched upon traceability in the bullet points list above. For this project, I use Azure Boards to manage work that needs doing. So all features, bugs, etc get a work-item (also known as a ticket in some platforms). I have a backlog of items and even though it's just me, and I'm only working for this client one day a week - I still use sprints, having one sprint per month (ie. 4-5 days). This allows me to plan a vague roadmap to the go-live date. The client has already seen how this works, can create work-items, and we use this for each of our progress catchup meetings.
In this recent meeting, given I was showing them the Git and CI/CD pipeline, I also then showed how work-items, Git commits, builds and deployments are all hyper-linked to each other. We're not using Pull Requests for this project, but if we were, the PRs would also be linked. This is so useful if you need to go back and either see why changes were made and what those changes affected, or what work has been done against a particular work item.
To automatically link a Git commit to a work item, just mention the work item in the commit message. Eg. "#123" in the commit description. Whilst I use Azure DevOps, most other similar solutions work the same way. Eg. GitHub, etc.
Monitoring
Monitoring is of course very important in your application. Work doesn't end when you hit the 'go-live' date and declare your app is "in production". Is your app erroring? Are web and database queries performing as expected? Are you just waiting for the end-user to tell you about issues, and assuming everything is hunky-dory if you don't hear anything? Ideally, you need dashboard, alerts, and logs in place. Dashboards to give you a general "at a glance" overview of the state of your system; alerts to notify you as soon as something goes wrong or isn't how it should be; and logs to help you drill down and diagnose problems when they arise.
Sounds complicated? Well yes it can be - but certainly not as complicated as you may think!
Application Insights
I'm calling out Application Insights because I use Azure and this is my go-to for website telemetry, and it's pretty mind blowing. However, the point of this blog post isn't about specific technology stacks, and me saying you should be using X, Y, and Z. There are plenty of other options - eg. DataDog, Retrace, Splunk, New Relic, RayGun and more. The point of this blog post is to highlight how spoilt we as developers really are with all this amazing tech.
But given I use App Insights, let's talk about that! With minimal work required, you get tons of logs, charts, error and diagnostic information out of the box.
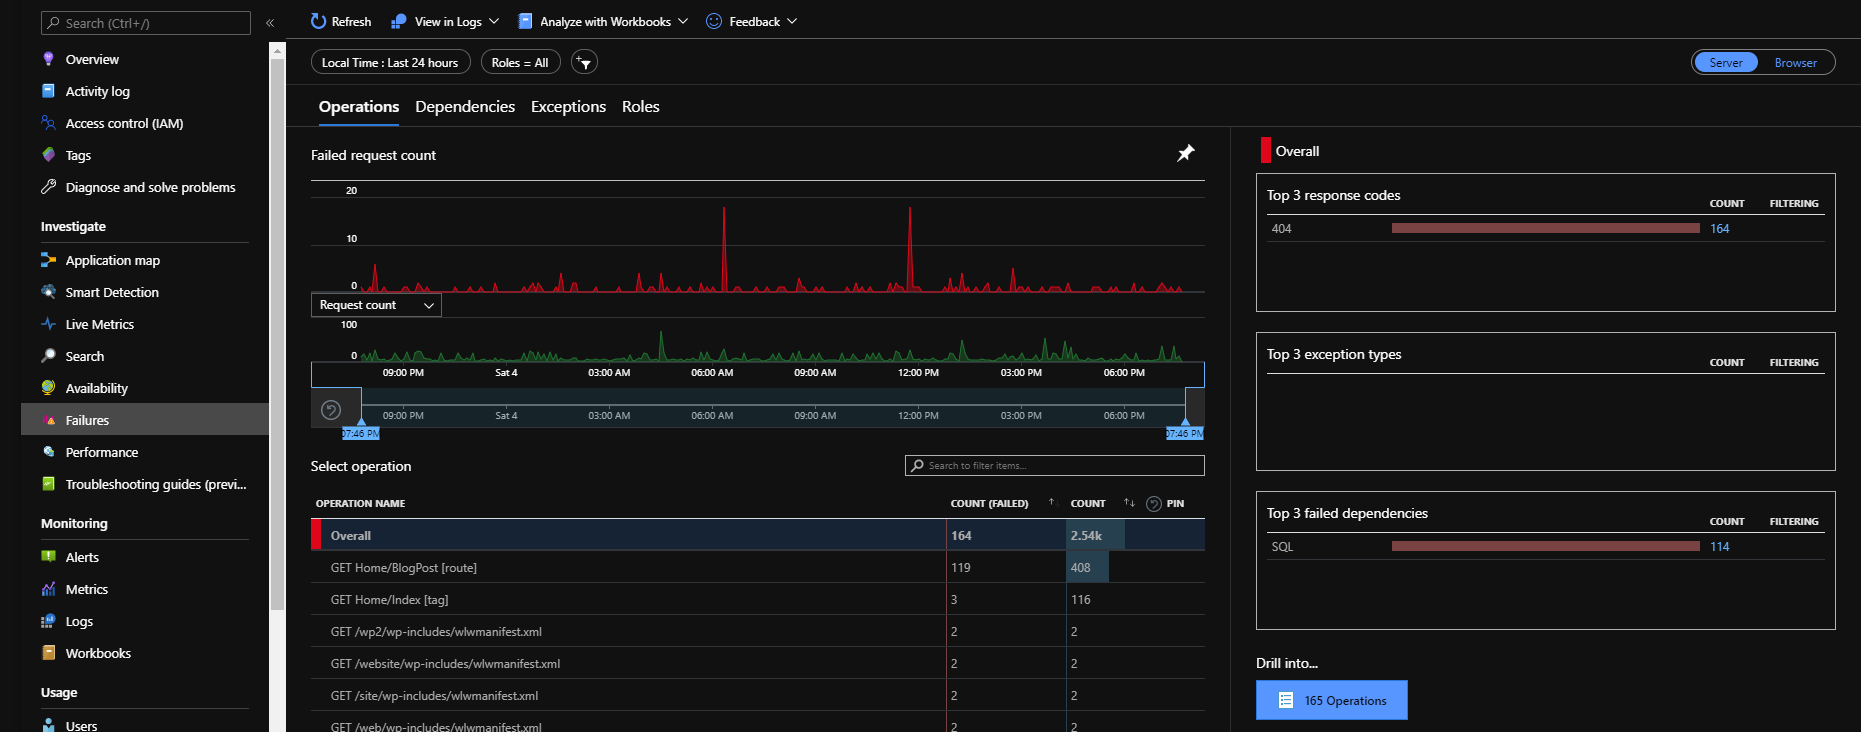
This is an example from this blog's monitoring. You can see there's a bunch of 404s, which are just bots, but there's also some SQL failures. Clicking on the count (ie. 114 on the bottom-right) drills in and shows you various information about that failure - including the call stack in the code, SQL queries, etc...
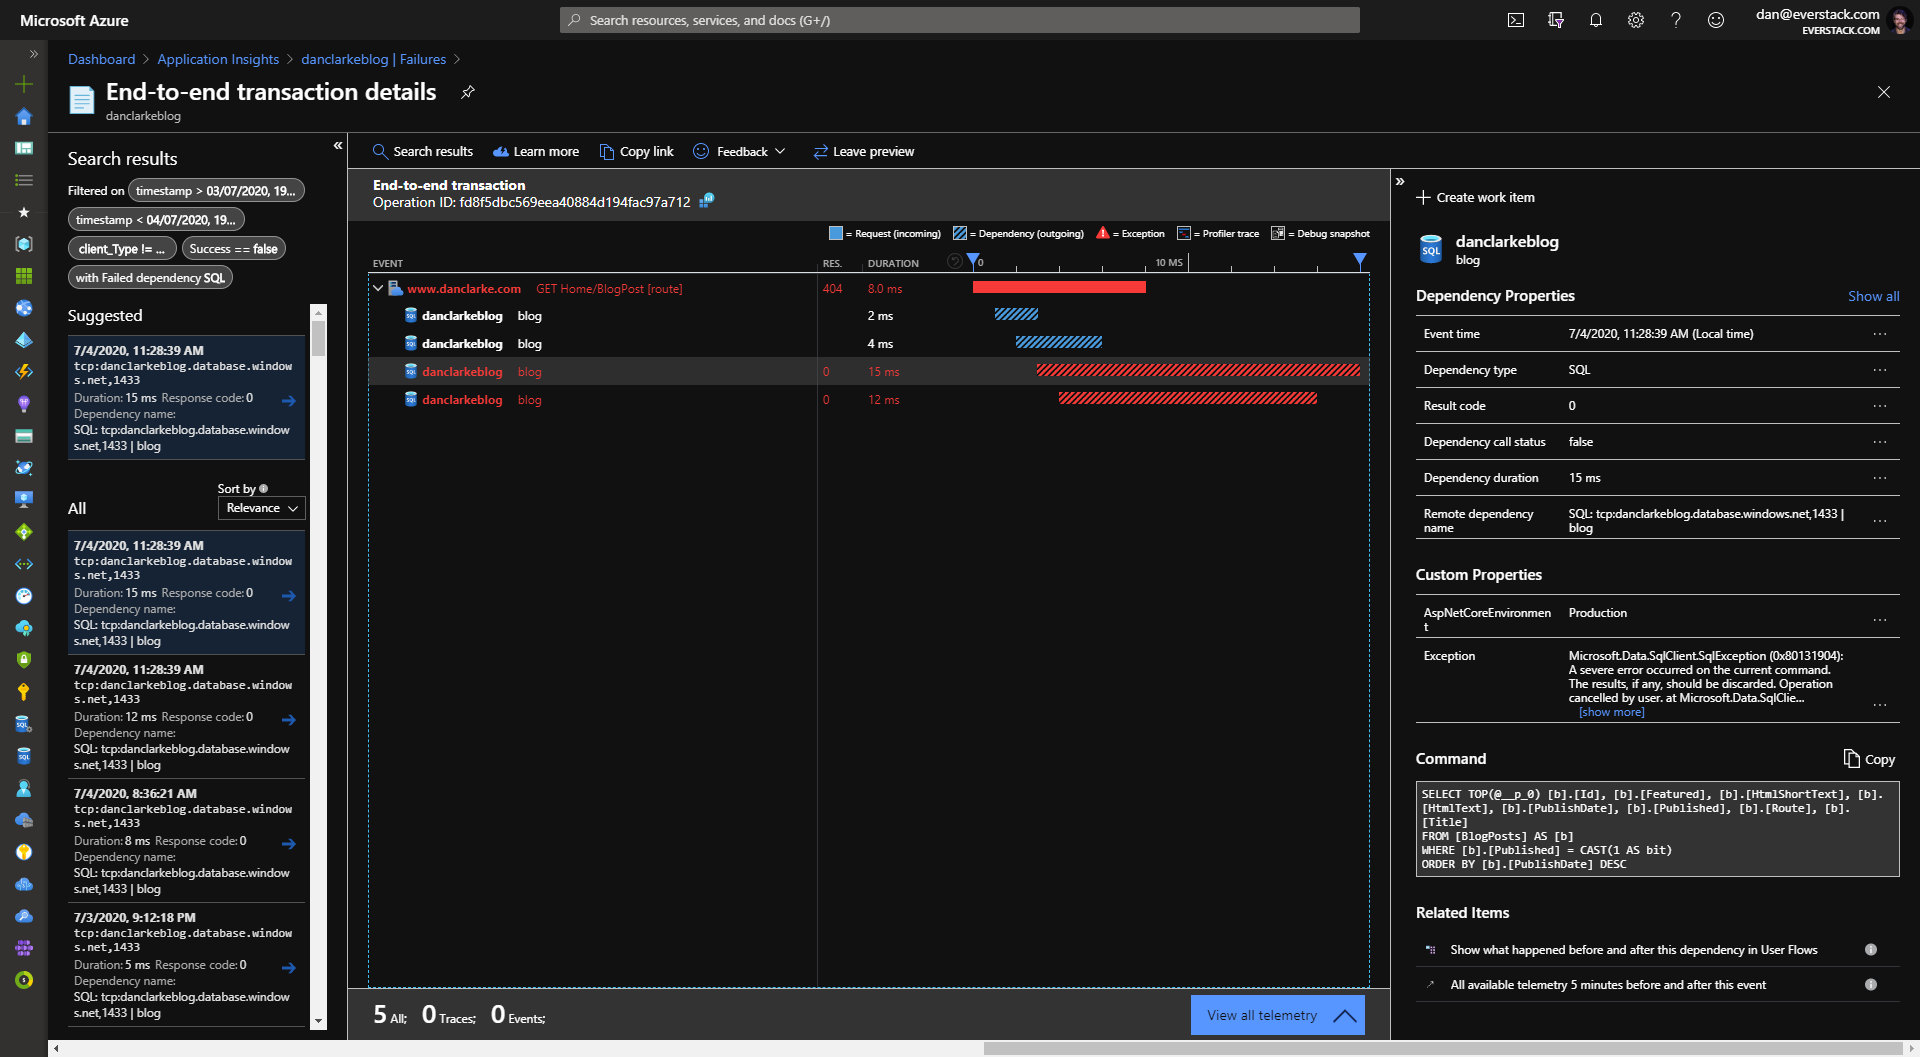
Notice the "Related Items" on the bottom-right of that screenshot. Clicking on those options allows to you see more information about what was happening around the error.
You can easily write powerful queries against your logs, that both filter and drill down on your logs, or even render custom visualisations...
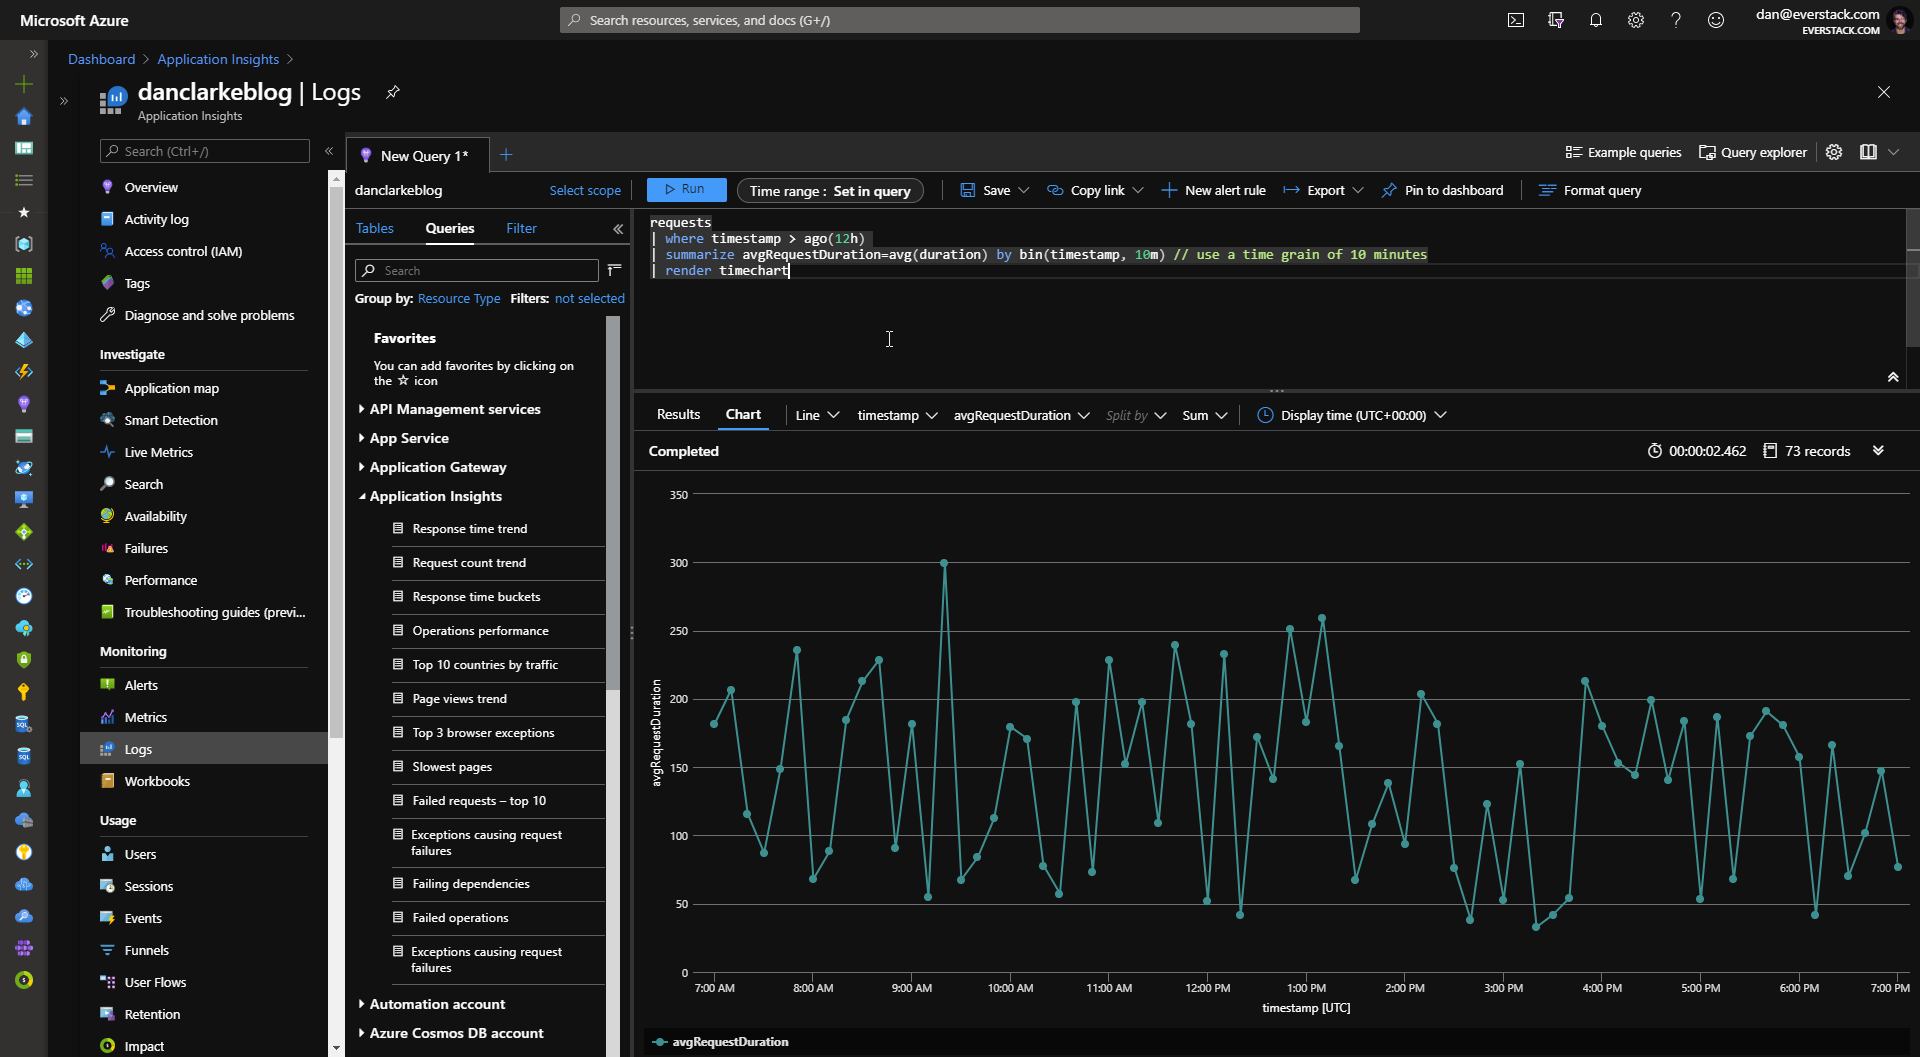
Notice the query panel in that screenshot with a SQL-like query? This is insanely powerful, and the intuitive intellisense make it even easier to write queries against your logs. You can dump out tables of trace log data, or render charts as in the above screenshot. These charts can easily be pinned to your dashboards (see below).
All of this pretty much out of the box. All you need to do after creating the App Insights service in Azure, is install a nuget or npm package into your app, and reference the instrumentation key for your App Insight instance. The rest is done for you.
Dashboards
I mentioned above, dashboards are a great way to give you a general overview of the state of your system. And you have quite a few options here. Obviously, using the built-in dashboarding solution will give you more flexibility, but will also mean you have to have different dashboards in different places. This might be okay though - it depends on your scenario.
Azure DevOps Dashboards
Azure DevOps supports creating custom dashboard for everything in your DevOps environment. For example, you can create dashboards containing your sprint burndowns and progress; status of builds and deployments; and more.
Azure Dashboards
Where you can use Azure DevOps Dashboards for DevOps information, you can also use Azure Dashboards for your Azure services information. This can give you at at a glance view of your cloud infrastructure. This includes information from your Application Insights (as mentioned above). Infact, most charts you see anywhere in the Azure Portal have a 'pin' icon to pin that chart to a dashboard!
Grafana
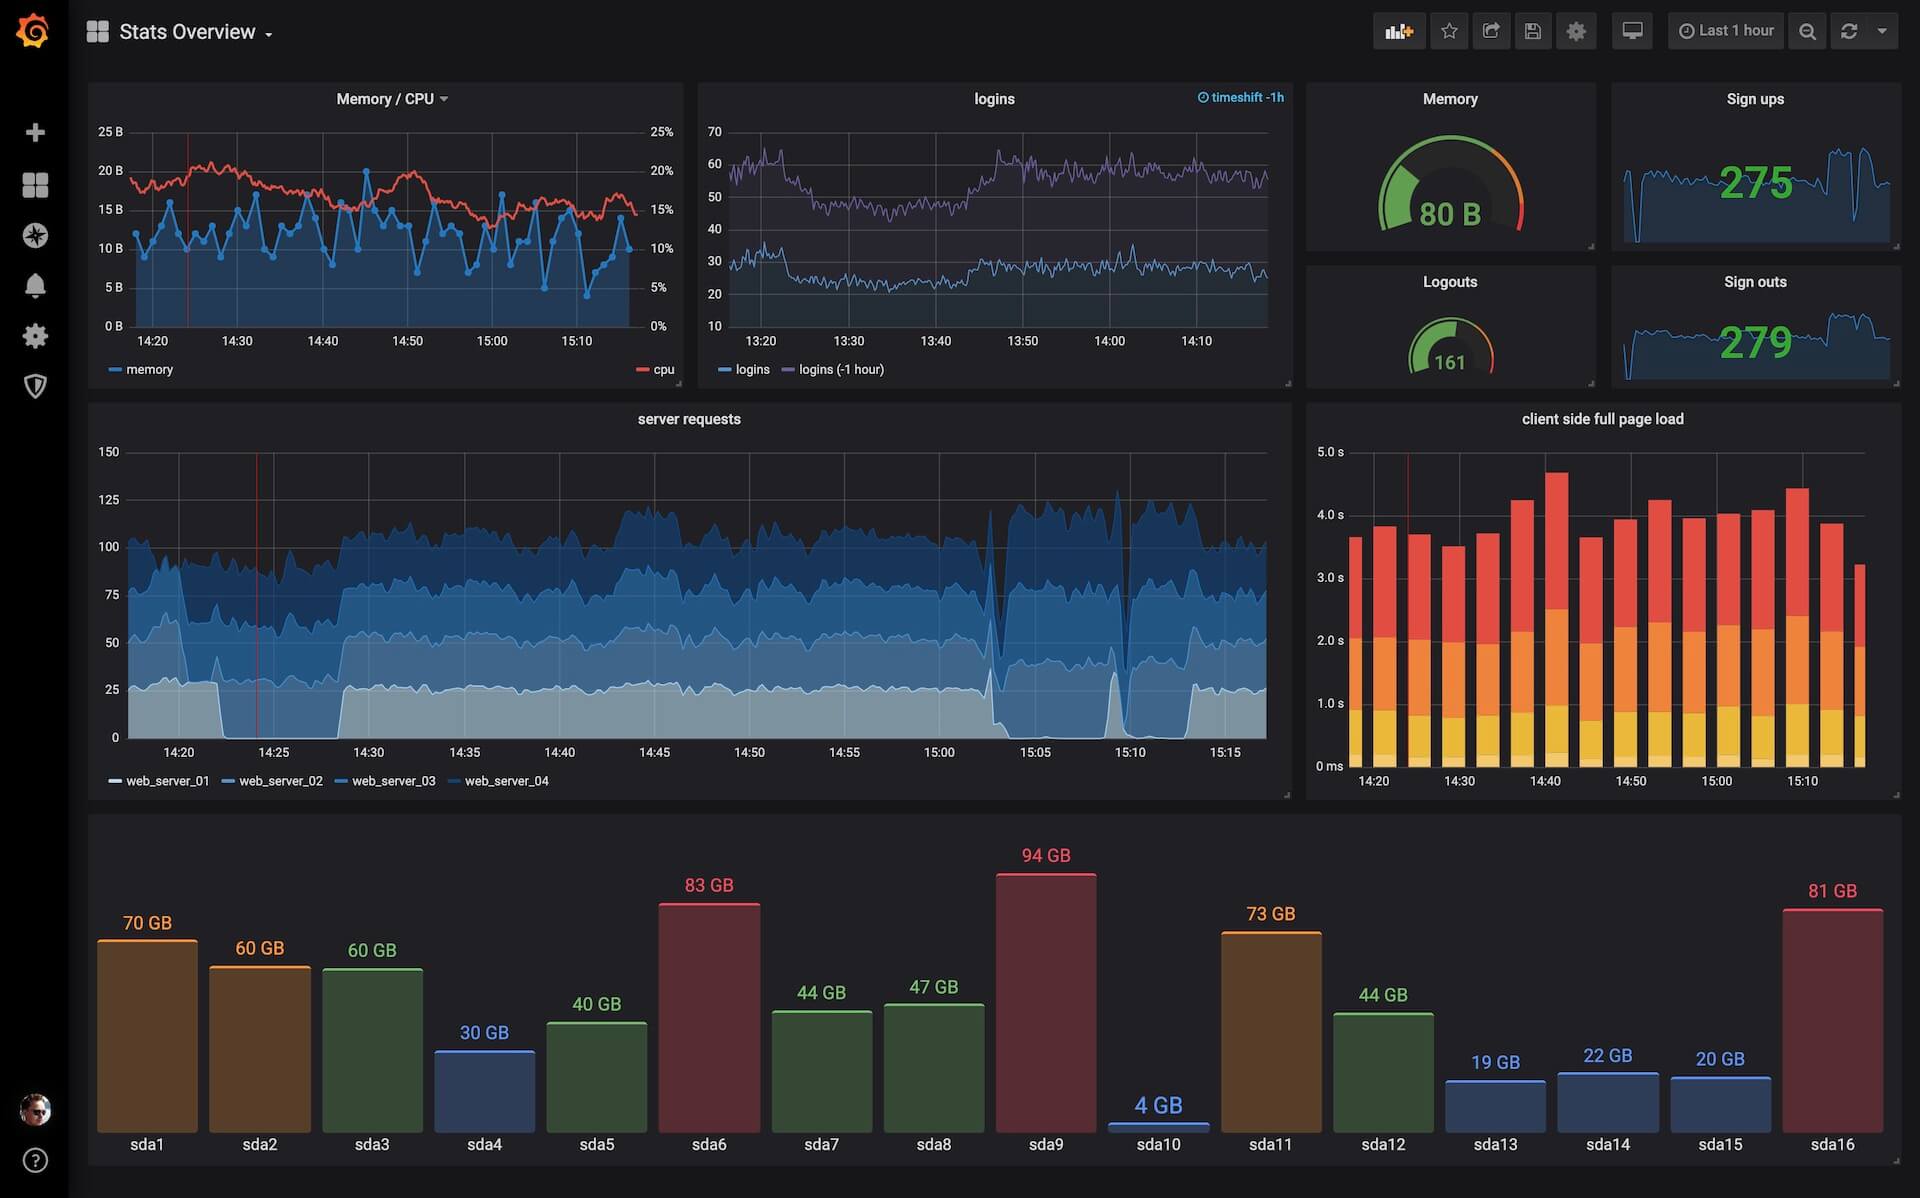
Grafana is an open-source dashboarding solution that can pull data from lots of different places. And Grafana dashboards look SO GOOD! Where the above-mentioned dashboards are very specific - with Grafana, you create 'data sources' which can pull data from various sources - eg. SQL Server, Postgres, Azure, Prometheus, time-series databases like InfluxDB, and much much more. Obviously depending on what you're dashboarding, you might not get the full power and flexibility of using native dashboards - eg. whilst you can dashboard data from Azure Monitor (including App Insights), you won't be able to drill into error information within Grafana. I tend to use a combination of both depending on what I'm doing. Because Grafana can pull from different data sources, you can create dashboards combining stuff from Azure, SQL, Prometheus instances, Google Analytics, DataDog, New Relic, etc and view it all in one place.
You can host Grafana in various ways. Spinning it up in Docker is one way. Which fits nicely if you're using Kubernetes. But even if you're not, you could put it on a VM or use Azure Container Instances, etc. They also have a hosted version, which has a free tier for basic usage.
I'm currently starting playing around with using Grafana to monitor personal stuff, like my todo list counts over time, home broadband usage, Strava stats, Google Analytics all in one place for various sites (eg. this blog, .NET Oxford and Azure Oxford websites), etc, etc.
Pricing
You'd have thought all this would be really expensive wouldn't you? Well, for a small team like I am, other than the Azure hosting itself, it costs nothing. You didn't mishear that - it doesn't cost me anything at all! You start to pay when you have a team of over 5 people (and still the first 5 remain free), and/or you need extra build agents, more space for packages, or the Test Plan functionality.
Oh, and automating your infrastructure deployment with ARM, Terraform, Pulumi, etc. - means you can destroy your dev/UAT environments automatically overnight and at weekends, then have them automatically spin up before everyone starts work. This can save you a ton on Azure hosting fees.
Summary
Imagine showing all this stuff to a developer from 10 years ago! I was finding I was taking this stuff completely for granted. Then when I had the meeting I discussed earlier where I was demoing it - it really stuck me - this is insane! Sure, there might be a lot to learn, but most of it isn't project-specific, and you can leverage this stuff for any of your projects. Then after that initial learning curve - you'll then be able to setup a 'devops' pipeline/process in less than an hour. Especially when you have all configuration as code - copy a few Azure DevOps YAML files, a few Terraform .tf files, etc - and away you go!
Comments