ELK Stack with .NET and Docker
I was recently investigating issues in some scheduling and dispatching code, which was actually quite difficult to visualize what was happening over time. So I decided to reach for the ELK Stack to help me see what was going on using time based charts. I've only used this briefly in the past, but given the very simple setup thanks to Docker, and also the power and flexibility of ELK, it made a huge difference in my investigations!
There was certainly an ha-ha moment as I discovered how easy it was to use and apply to even just local debugging scenarios. It almost made me feel like I'd suddenly acquired a new superpower - and in a way, I had! So I thought it was worth a post to share how to quickly get started for those that haven't used it before.
What is the ELK Stack?
Before going too much further, I should really explain what it actually is. ELK stands for three different technologies ...
- Elasticsearch
- Logstash
- Kibana
Elasticsearch is a both a database and search and analytics engine. But at least for this post, just think of it as the datastore for your logs, but know that it's actually doing a lot more than this behind the scenes.
Logstash handles collecting data from multiple sources, transforming it, and sending it to a single datastore (in the case of ELK, this target datasource is Elasticsearch). It can collect data from lots of different source - eg. log files, databases, event logs, etc. However, we're not actually going to use this component in our examples, as we're going to write straight to Elasticsearch. So we'll be pretty much using the EK stack rather than the ELK stack!
Kibana is the frontend web interface where you can search and filter your data, generate graphs and visualizations on top of those queries, and then create all sorts of weird and wonderful dashboards. It's really powerful and flexible, and actually really easy to use - so non-developers can still jump in and get their hands dirty with the data.

Getting started easily with Docker!
So a pre-requisite to getting starting easily with Docker, is actually having Docker installed, which also is fairly easy!
What Docker actually is is beyond the scope of this post, but there's plenty of documentation if you haven't used it before. I'm using Docker for Windows on Windows 10, but that's kind of irrelevant for this post - just go to www.docker.com and choose Get Docker from the top navbar, and install for your OS of choice.
One installed, pop over to this GitHub repo - https://github.com/deviantony/docker-elk, and download it locally.
Then open a command line, change directory to where you downloaded that repo, and type docker-compose up.
That's it! The very first time you run the command, it'll have to download all the images, so will take a bit longer, but once done, you'll start to see the console output from the ELK Stack...

Note that Kibana takes a minute or so to be accessible. In the console logs in the screenshot above, you can see the following message which explains why ...
Optimizing and caching bundles for kibana, stateSessionStorageRedirect, timelion and status_page. This may take a few minutes.
Once it has finishing doing it's thing, you should be able to access Kibana in your browser by navigating to http://localhost:5601.
Index Patterns
When you first load Kibana, you'll be greeted with the following screen ...
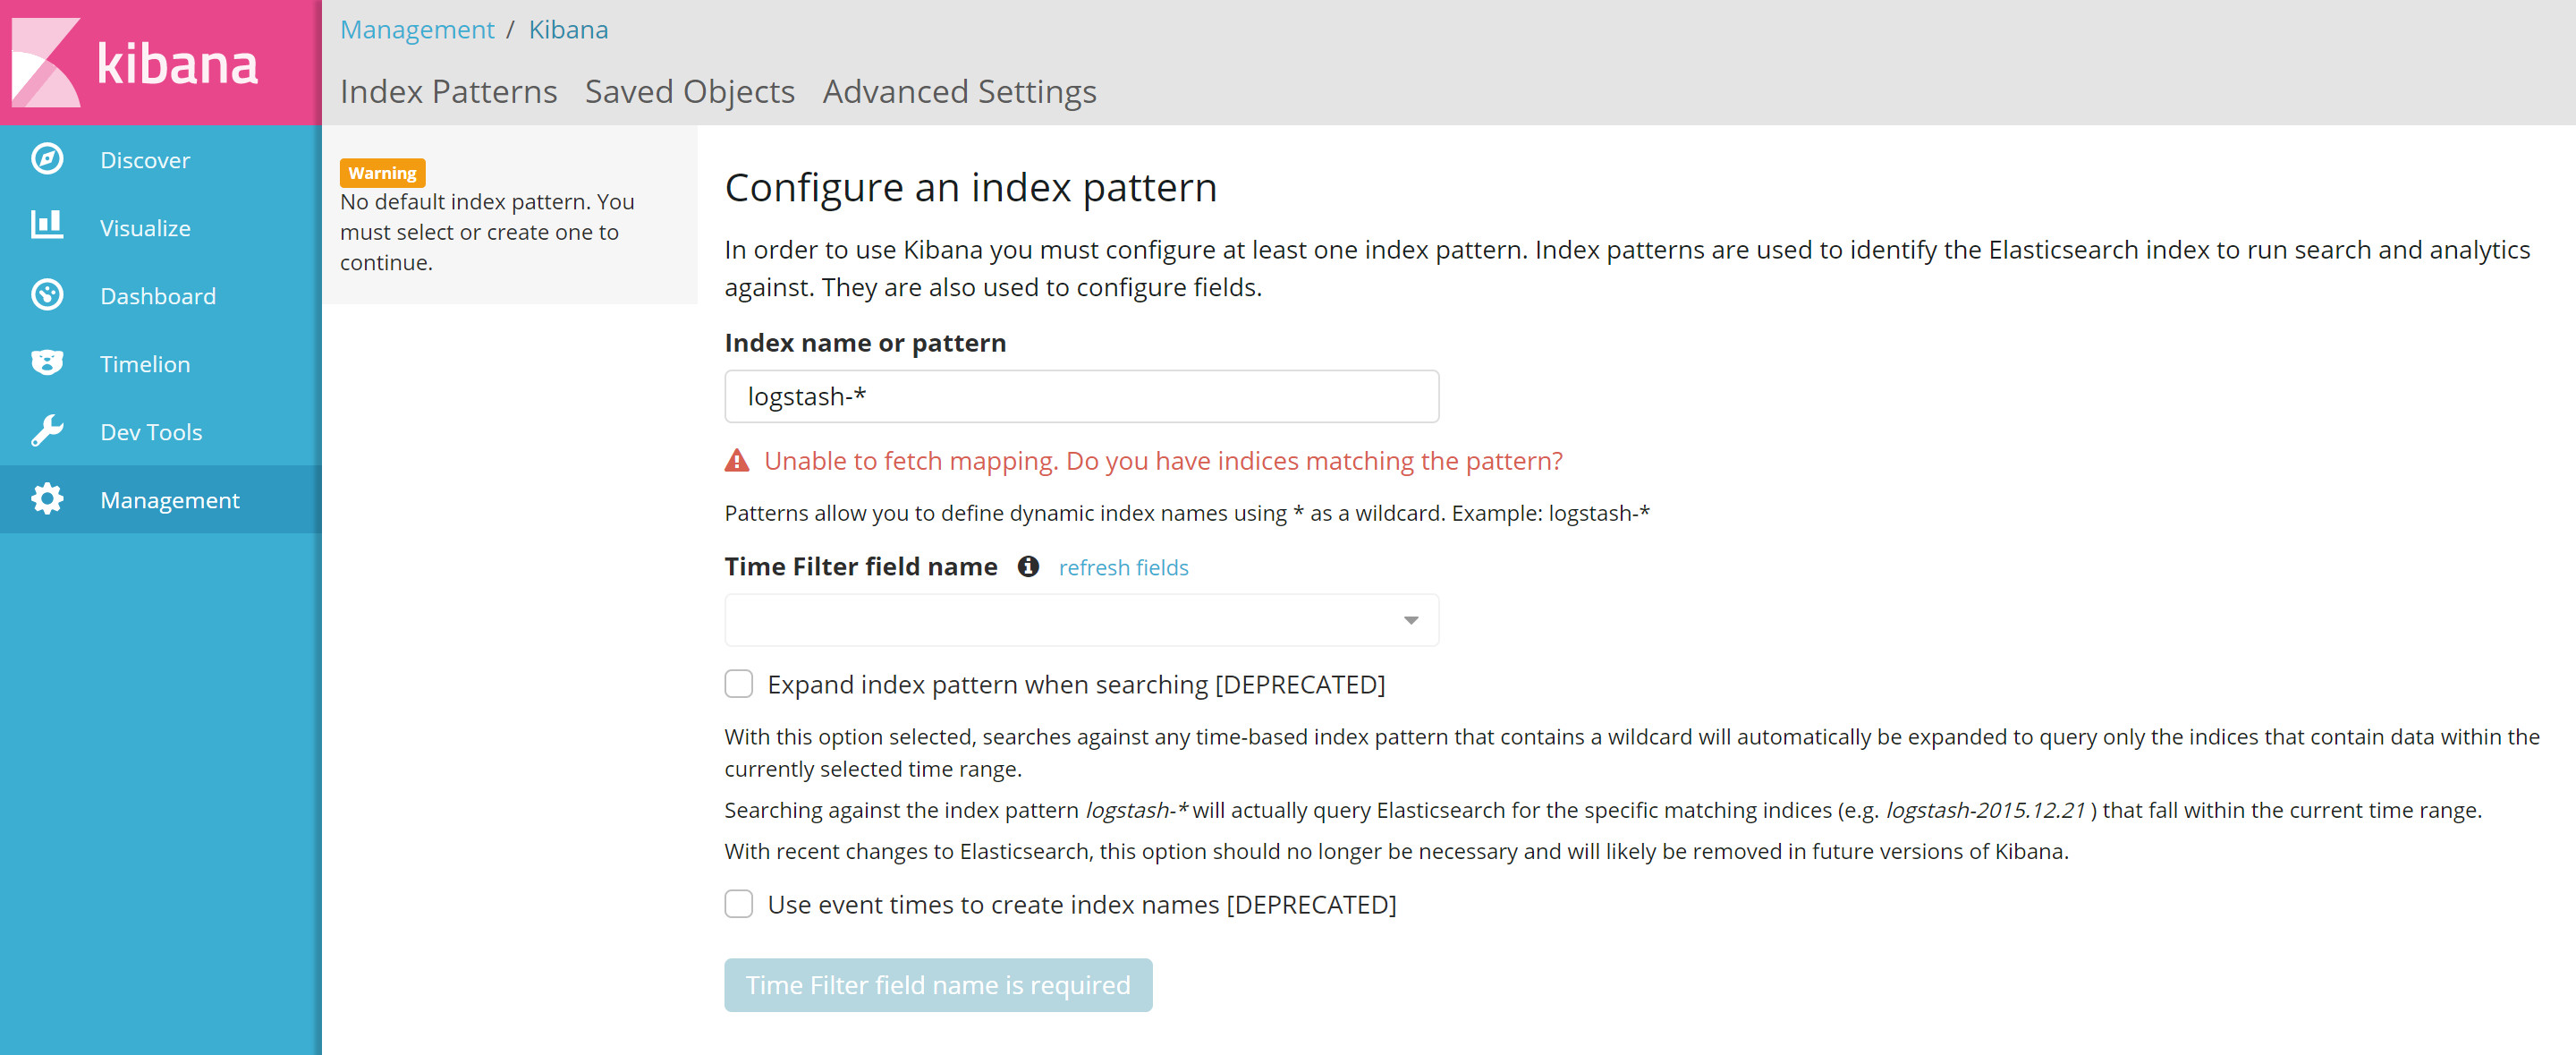
At least one index pattern must be created before you can use Kibana. Before being able to do this though, we'll need to actually write some data ...
Writing data to Elasticsearch with Serilog
Serilog is yet another logging library, like NLog or Log4net, except with a slight difference. Serilog supports structured data in its logs using parametrized statements. For example, you can do this ...
var position = new { Latitude = 25, Longitude = 134 };
var elapsedMs = 34;

log.Information("Processed {@Position} in {Elapsed:000} ms.", position, elapsedMs);
Because the {@Position} parameter has an @ symbol, this means that it will serialize this object, so is great for sending more complex types. In our example below though, we only need to send simple types to Elasticsearch.
Serilog has a concept of sinks. These are basically just output targets for the logs. There are many provided sinks, plus plenty of 3rd party ones created by the community. Looking through the list of provided sinks, we have serilog-sinks-elasticsearch - which is just what we need!
So now, we can use Serilog to write structured data to Elasticsearch, and then browse and visualize that data with Kibana!
Simple example in LINQPad
Everyone who knows me or reads my blog knows that I'm a huge fan of LINQPad. Below is a very simple example in LINQPad showing setting up a Serilog logger and writing to ElasticSearch.
<Query Kind="Statements">
  <NuGetReference>Serilog</NuGetReference>
  <NuGetReference>Serilog.Sinks.Elasticsearch</NuGetReference>
  <Namespace>Serilog.Core</Namespace>
  <Namespace>Serilog</Namespace>
  <Namespace>Serilog.Sinks.Elasticsearch</Namespace>
</Query>

Log.Logger = new LoggerConfiguration()
    .WriteTo.Elasticsearch(new ElasticsearchSinkOptions(new Uri("http://localhost:9200"))
    {
        AutoRegisterTemplate = true,
        IndexFormat = "elkdemo-{yyyy.MM.dd}",
    }).CreateLogger();

for (var n = 0d; ; n+=0.1d)
{
    var value = Math.Sin(n) * 100;
    Log.Information("{Key},{NValue}", "ForLoopDemo", value);
    Thread.Sleep(1000);
}
Update (1st Dec 2017): The above no longer seems to work when you set the
IndexFormatproperty. I'm not sure why, but if you find it doesn't work, then just comment out that line. It'll then use the default IndexFormat oflogstash-*, so when following the below instructions, replaceelkdemowithlogstash.
If you paste the above directly into LINQPad - get rid of the XML at the top and manually add the nuget packages. Whilst a LINQPad script does contain this meta data, the UI hides it - so if you paste directly into LINQPad, it'll think this is code and not metadata, and fail to run. It's easier to just copy the above into a .linq file using Notepad, then open that file with LINQPad. I just wanted to also include the Nuget references in the above example.
All this script does is constantly iterate through a for-loop and send values to Elasticsearch plotting a sine wave. The idea is that it can be left running, and we'll set our Kibana dashboard to auto-refresh so we can see data coming in.
When trying to diagnose the real-world scenario I mentioned at the start of this post - I ended up logging real-time metrics from both the application itself, and also at the same time running a similar loop to the above LINQPad which was querying and logging data from the database.
A couple of things it's worth pointing out about the scripts ...
- The endpoint uri is
http://localhost:9200. Because Docker is running locally, we can access it vialocalhost. And 9200 is the default Elasticsearch port, and was specified in the Docker compose file we downloaded earlier. - I'm setting
IndexFormatto"elkdemo-{yyyy.MM.dd}". This is related to the "Index Patterns" section above. Once we write this data, we'll then be able to create an index using Kibana on the page shown in the screenshot above. - When we call
Log.Information, we're passing parameterized values using{and}. Note that weren't not using string interpolation here, as this isn't how Serilog works. TheKeyandNValueparameters will be passed to Elasticsearch as types which we can then reference in Kibana.
Kibana: Creating an Index
So after starting the above script, we now have some data in our Elasticsearch instance. Going back to Kibana, we are now able to create our index by typing in elkdemo-* as the index pattern. Notice that there's a @timestamp field. We'll be using this for the x-axis in our graph, and this gets added automatically, so we do not need to explicitly add a timestamp to our Serilog log parameters each time we write a log.

Click on 'Create', then you'll be able to start exploring your data.
Kibana: Discovering Data
The first port of call is to search your data and save a query which we can use in our visualizations. So let's head over to the Discover tab ...
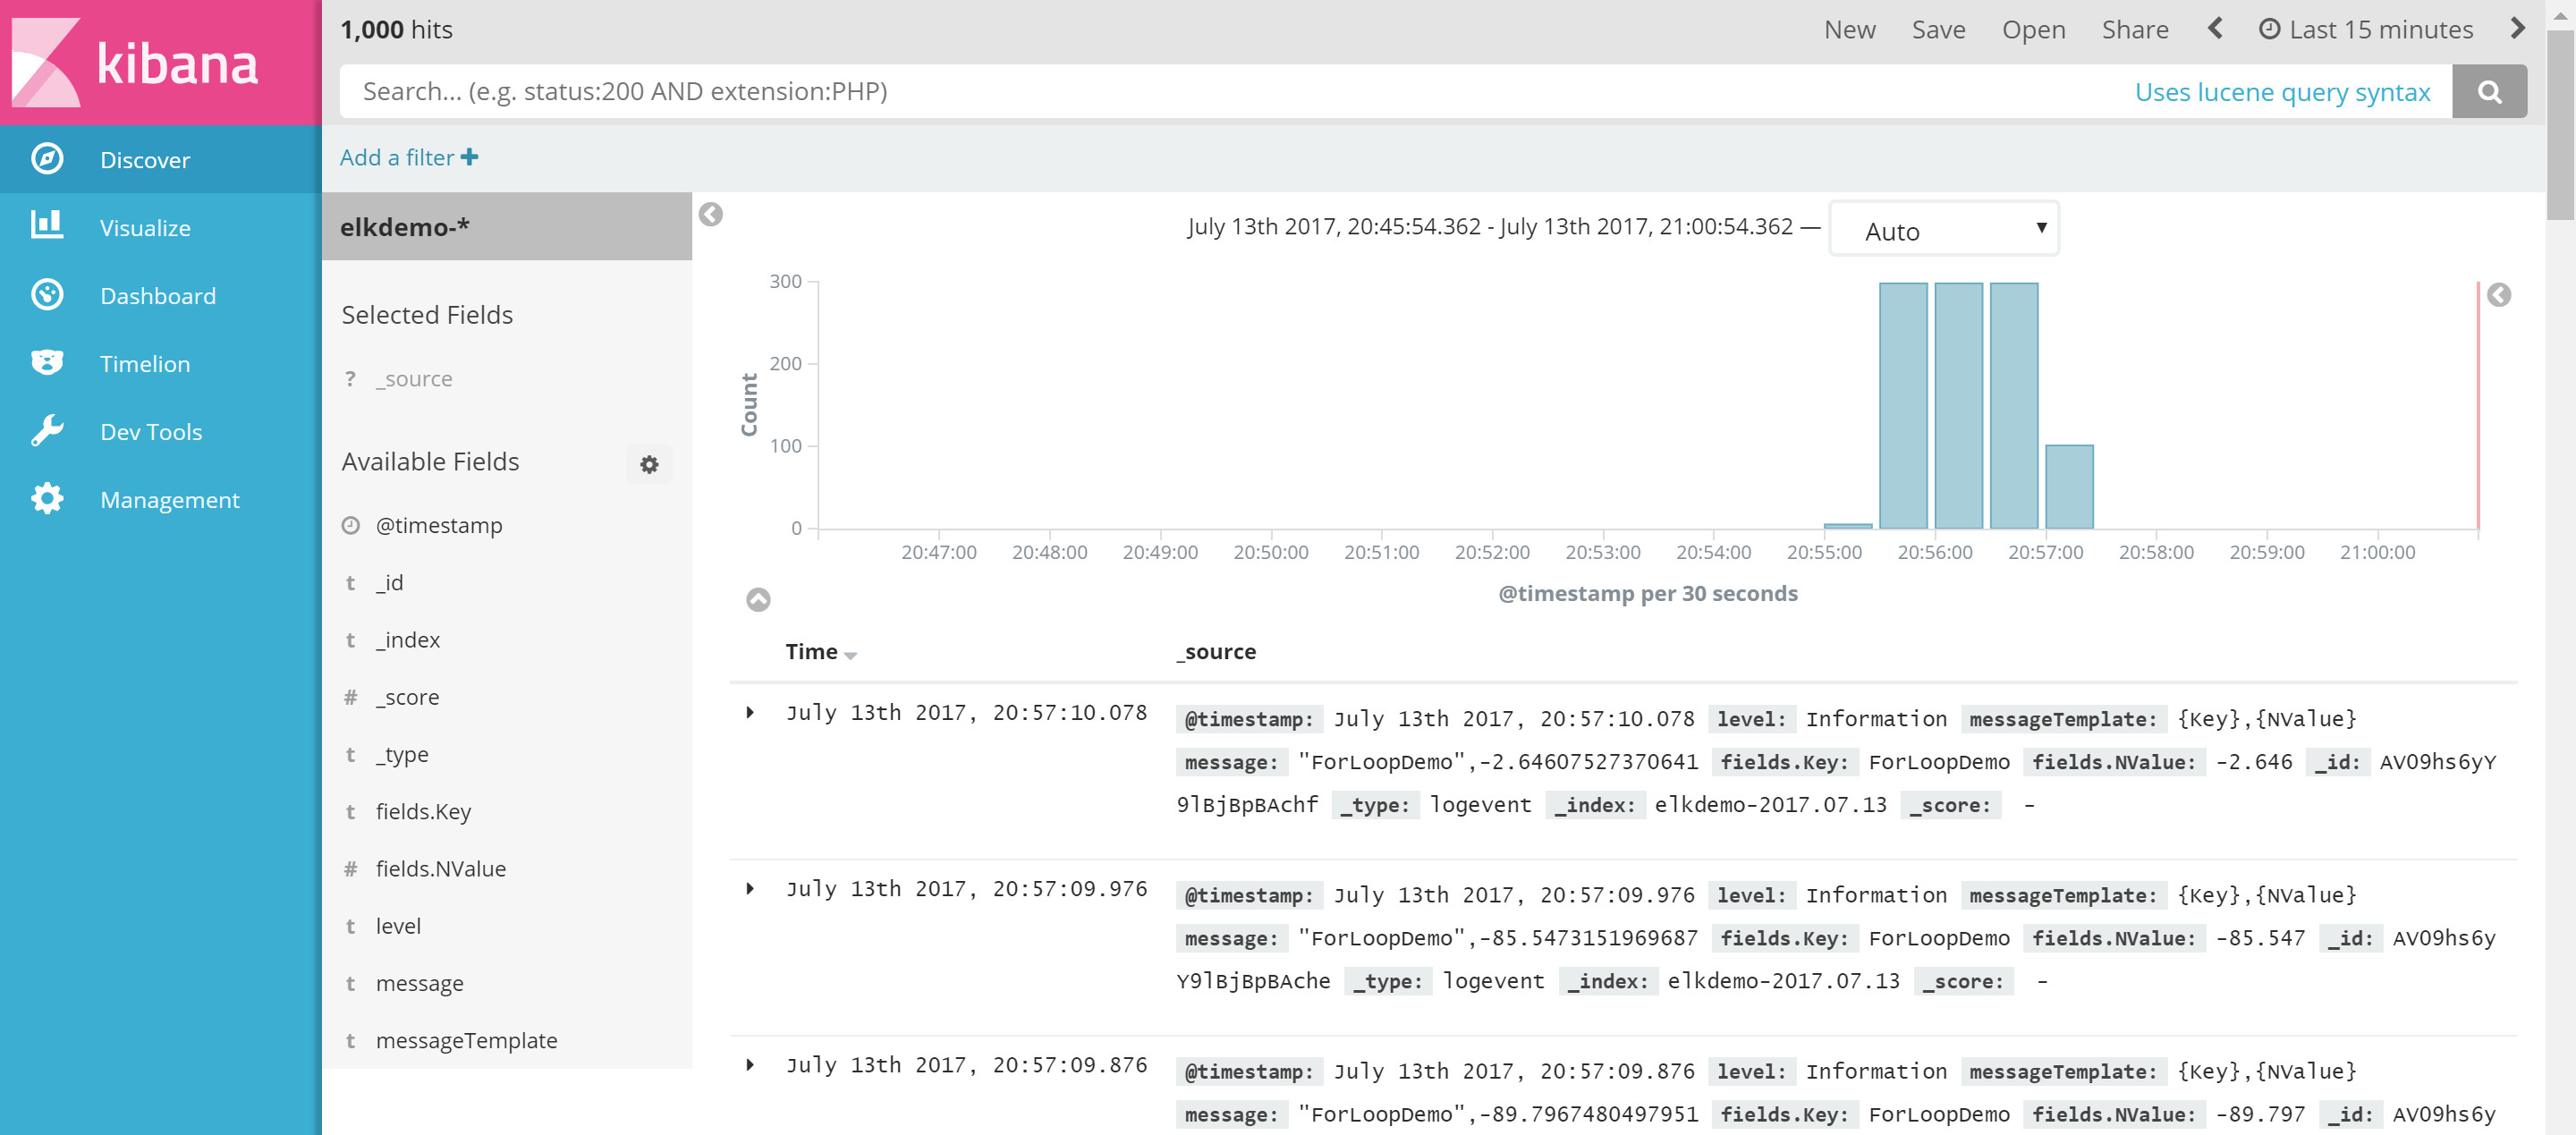
We can now see our data. However, that's currently showing us everything in our index. When you hover the mouse over one of the Available Fields on the left, you'll see an Add button appear. Adding a field will add it to the Selected Fields list above it. When you have one or more field in this list, then that's all you'll see in the results...

Notice that I've added the two parameterized fields from our Serilog log? Also note that the ForLoopDemo entries are highlighted in orange. This is because I've filtered to only include records where the key is ForLoopDemo. This is easily done by clicking on a little icon next to the value in the cell. The icon only appears on mouse-hover, so unfortunately not shown in the screenshot above.
Once we're happy with the filter, then click on Save, and give your query a name.
Kibana: Creating a Visualization
The next step is to create a visualization. So over to the Visualize tab ...
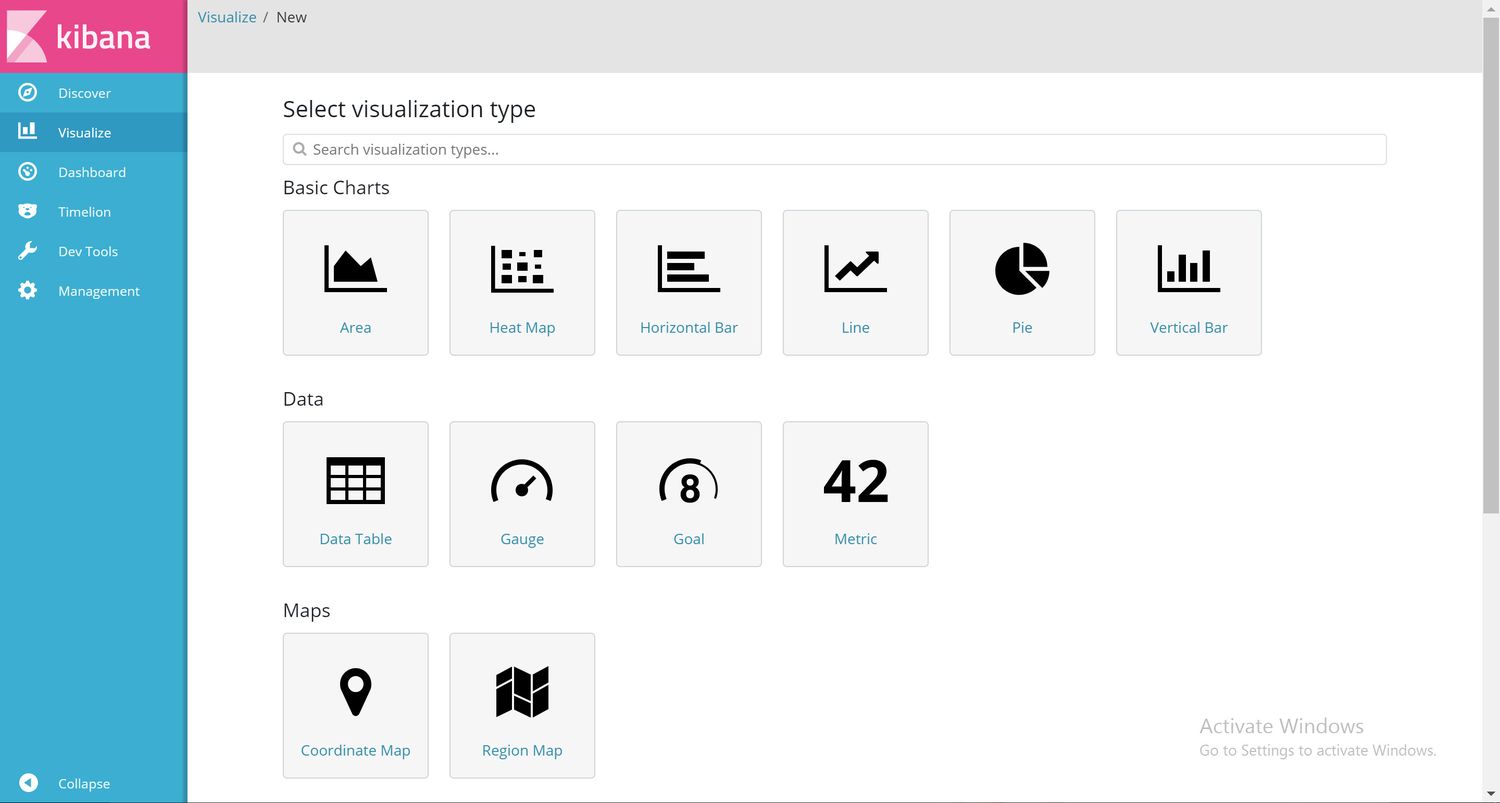
I've actually skipped a page here. When you first go to the visualization tab, you'll get an empty page where you can click a + button to create a new visualization. Not really worth a screenshot though!
As you can see, there's a few types of visualizations you can create. There's a couple more if I'd scrolled down, plus you can download more, or even create your own.
For this very simple demo though, we'll just use the line chart. When you choose this option, you'll get a screen where you can either create a new search, or choose a saved search. We saved our search earlier on the Discover page, so we'll pick this one.
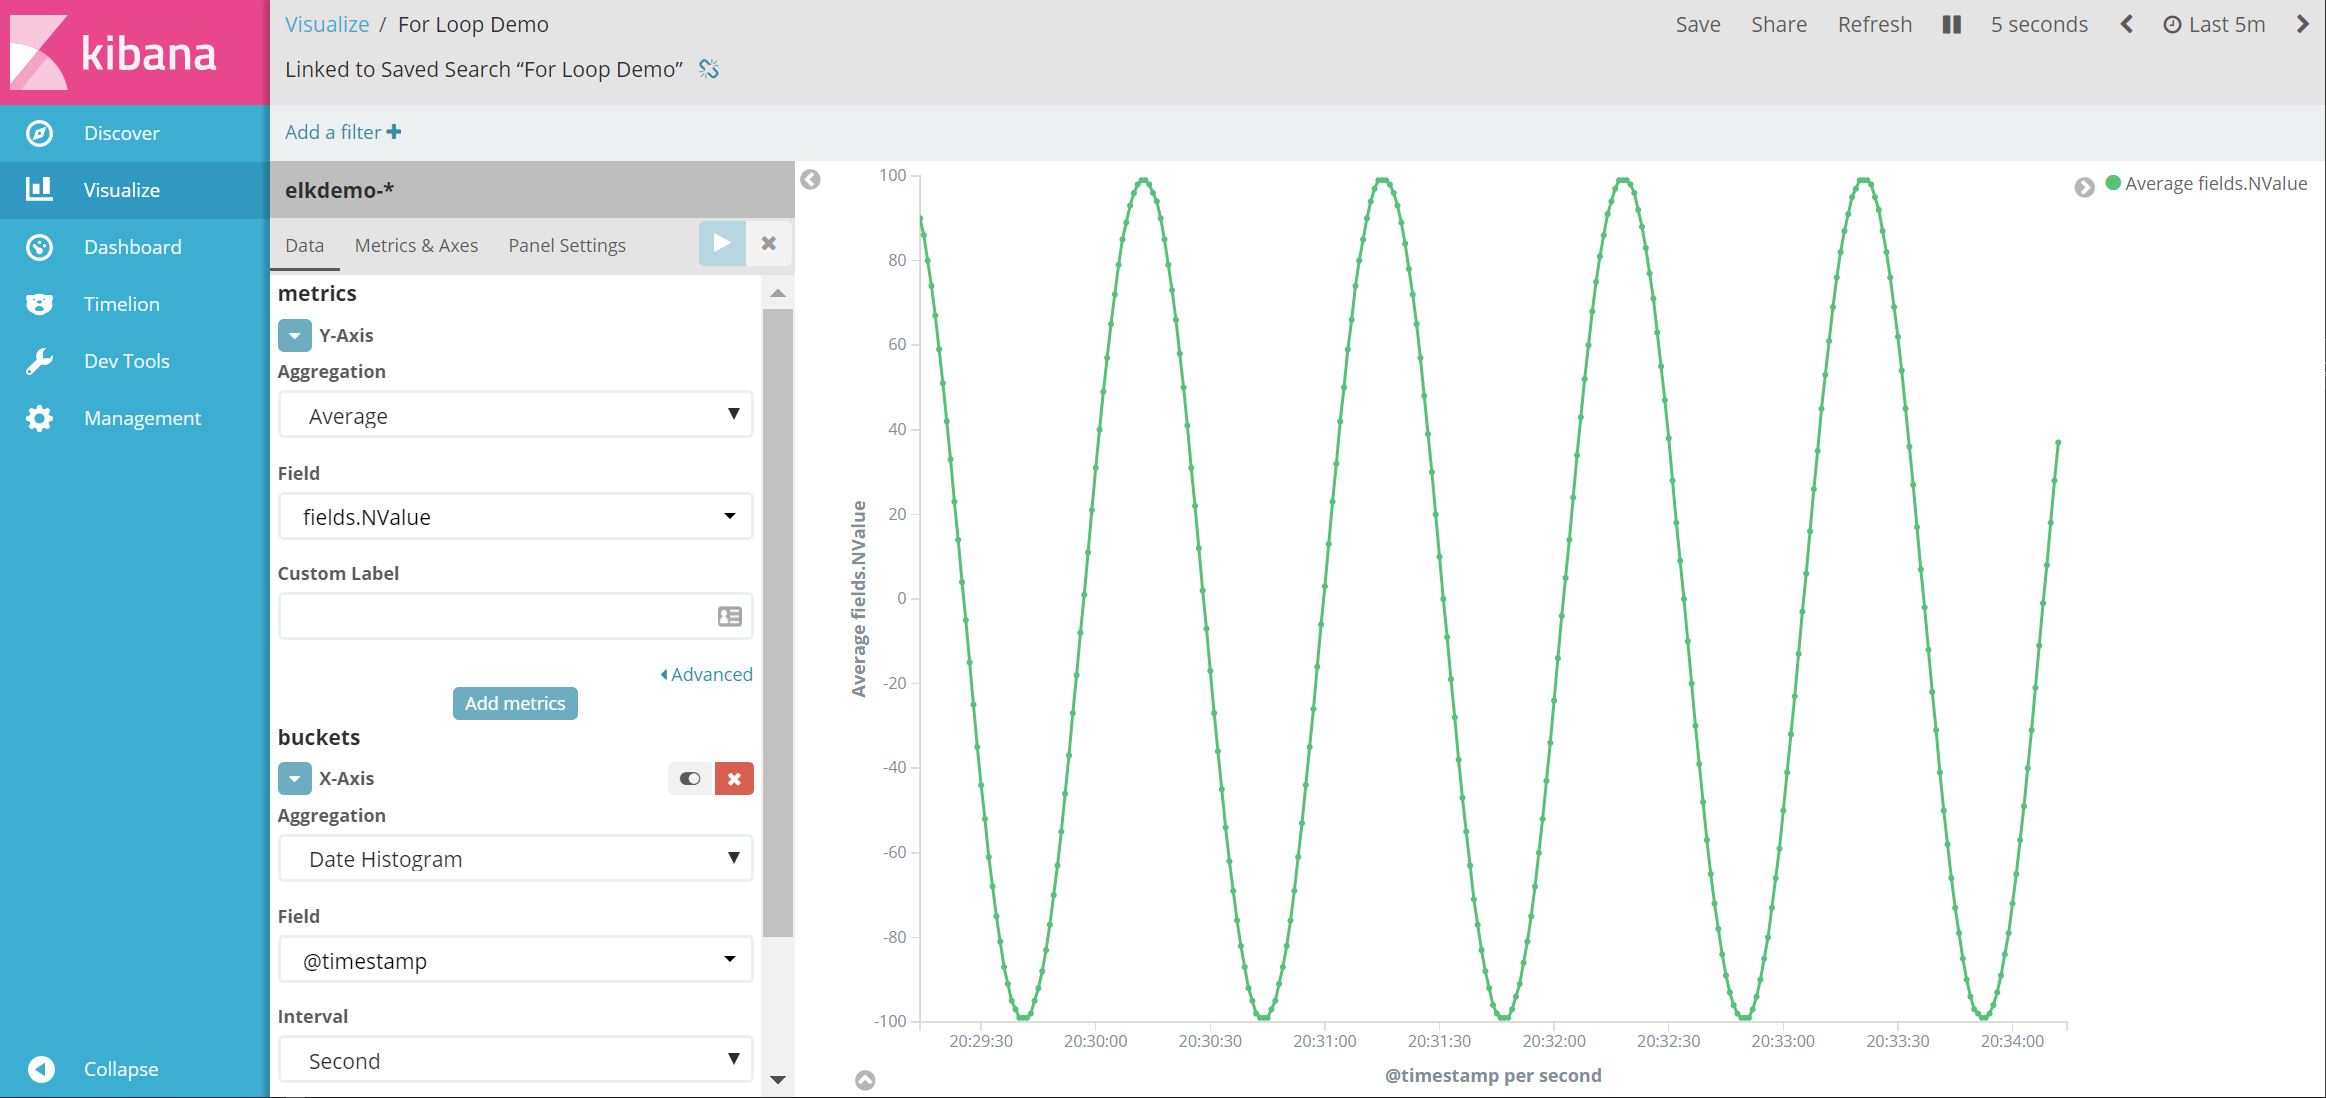
We're then greeted with the following page ...
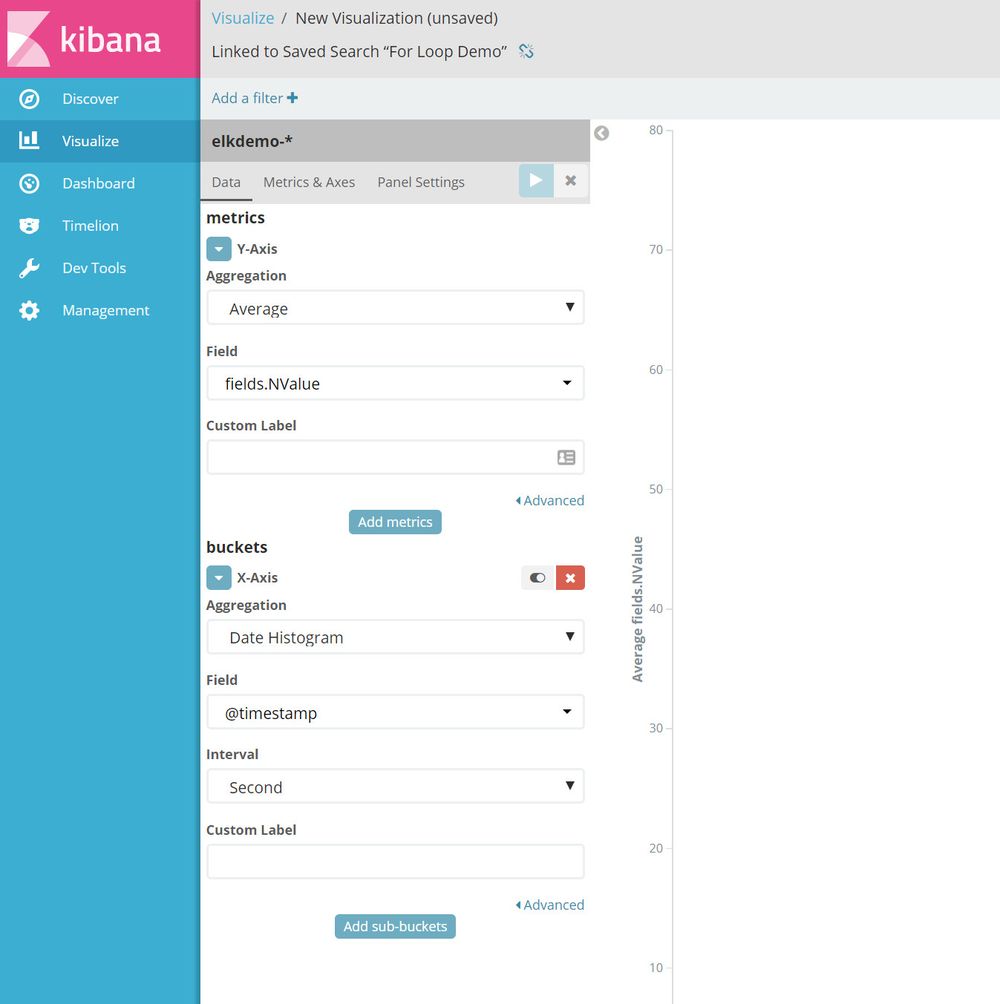
I've actually already pre-populated some of the fields in the screenshot to save on having two screenshots. Here are some things to note ...
- For the x-axis, I've chosen the
Date Histogram, and am using the@timestampfield which is the automatically included timestamp I mentioned earlier. - I've changed the
Intervalto seconds. Depending on the data, Kibana might increase the actual interval used if there are too many data points within the timespan you're visualizing. This is basically a timespan that is used to put our data into buckets as you may well have far more datapoints than pixels rendered in your graph! - For the y-axis, I've chosen our
NValuefield, have also chosen toaverageour values that are clumbed together in each our of interval buckets. This aggregation is actually done in Elasticsearch, Kibana just passes the options along to it.
If we press the blue play button, we'll now see the graph on the right ...
So let's now save that, and add it to a dashboard ...
Kibana: Creating a Dashboard
Creating a dashboard follows the same pattern as creating the other items we've described. Click on the Dashboard tab on the left, then click on the + item to create a new Dashboard. You can create just add your visualizations to your dashboard, resizing them as you see fit. Then you can save it and give the dashboard a name.
Below I've just kept it really simple and added our sine wave visualzation. But obviously you can create much more complicated dashboard showing various metrics and visualizations. You can even add a Markdown widgets!
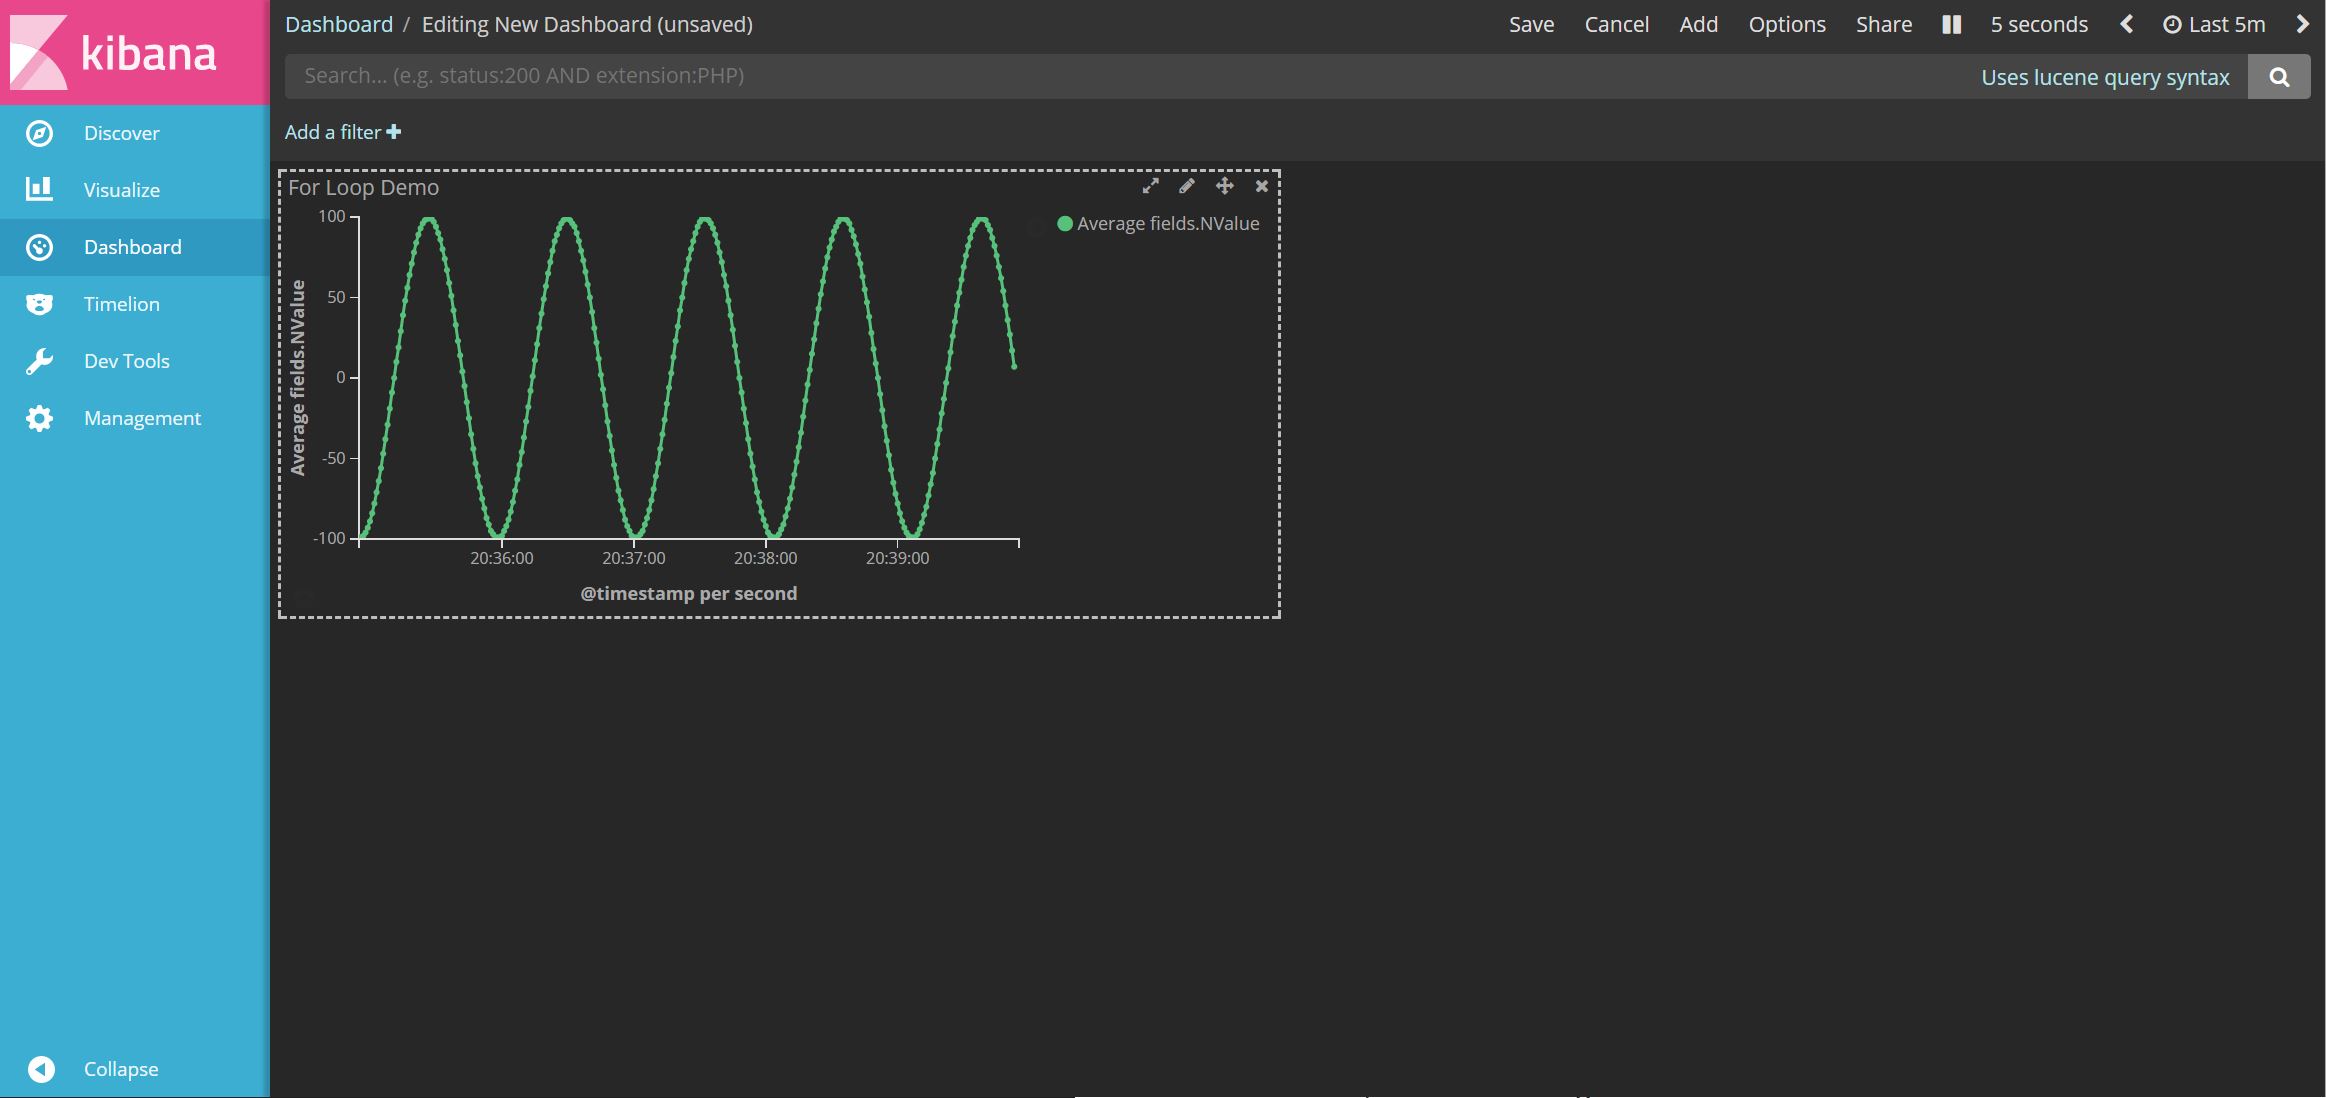
At the top of the dashboard, you can also change the timeframe that the dashboard currently relates to. In the screenshot, you can see I've set this to 5 minutes. Likewise with the auto-refresh frequency, which I've set to every 5 seconds.
You'll notice that the dashboard has a dark theme. By default it was a light them, but there's an option at the top to switch to a dark theme - and we really like dark themes!
Moving our data out of the container using Docker Volumes
Before wrapping up this post, I should point out that as it currently stands, the GitHub repo with the Docker files in it will store the Elasticsearch database inside its container. So if you get rid of the container, you've also lost both your data and your Kibana bits and pieces. This obviously isn't ideal, as containers are supposed to be disposable. So to get around this, we need to use volumes so that the container can reference a shared folder outside the container. This is really easy, and just involves a small tweak to the docker-compose file. Details can be found here in the GitHub repo's readme.
Summary
The example above is obviously an extremely simplistic usage to demonstrate the workflow without having to introduce any complex business domain to this post. In my actual use-case, I had both our Windows Service dumping quite a lot of metrics, and also LINQPad polling the database dumping even more metrics. Then my dashboard was full of various charts. Definitely a tool I'll be reaching for quite often in the future!
Please retweet if you enjoyed this post ...
Blogged: "ELK Stack with .NET and Docker" https://t.co/LGxpEmQs8Q #ELK #dotnet #Docker #LINQPad
— Dan Clarke (@dracan) July 15, 2017
Comments