Visualising your Workflowy database in Neo4j
I'm a heavy user of Workflowy, which is an amazing tool for taking notes. Due to the very hierarchical nature of Workflowy, I had a random idea that this would make a very cool Neo4j visualization! So I made a thing, and put it on GitHub.
First of all though, I should really explain what both Workflowy and Neo4j actually are ...
Workflowy
The simplest description of Workflowy is that it allows you to create lists consisting of bullet points, and those bullet points can be indented / nested. But that doesn't sound very interesting does it? Microsoft Word can do that can't it?
So the power comes from the ability to zoom into any node in the hierarchy. This means that you can store a huge amount of data in Workflowy about various things - notes, todo lists, project details and breakdowns, bookmarks, recipes, gym workouts, inventory, holiday information, and anything else you can imagine!
There's also some really useful keyboard shortcuts in the Workflowy user interface which really helps you to quickly navigate your hierarchy.
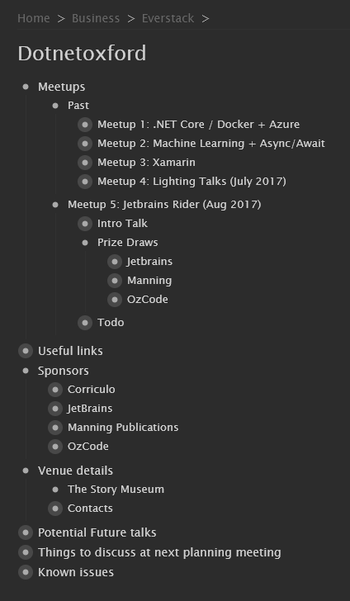
The below screenshot shows that I'm zoomed into the .NET Oxford planning node. The bullet points with the halo indicate collapsed nodes with more information. Bare in mind that my entire Workflowy account has everything from my various project details and todos, to recipe lists, to holiday information, to info about my kids nursery, etc. And yet in the screenshot, you can see that I can happily work in the context of just .NET Oxford without all that other stuff getting in the way.
Neo4j
Neo4j is a graph database. Graph databases are designed to be highly relational. So you're storing data in nodes which can have relationships pointing at other nodes.
It comes with the Neo4j Browser, which is a really nice user interface for browsing your data - allowing you to enter queries which then get rendered into a graph visualization ...
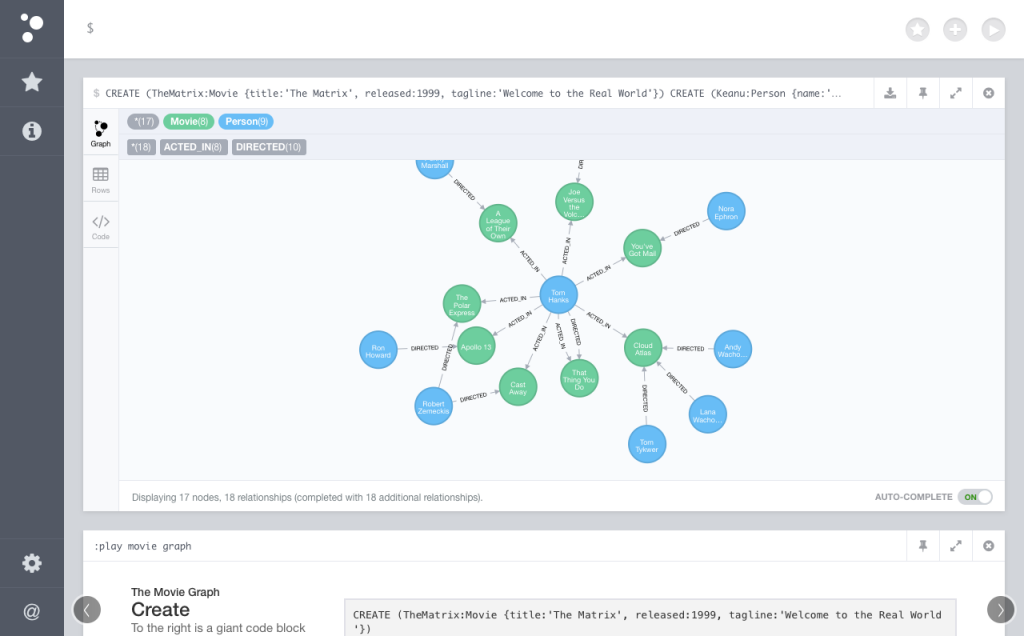 (example taken from their website here)
In the browser, you can drag nodes around, expand and collapse nodes, etc. All with really nice animations (see animated gif further down this blog post).
Let's do this!
Right, as you've probably gathered by now - a large Workflowy dataset would make an awesome Neo4j visualization! So, I wrote some code, and put it on GitHub ...
https://github.com/dracan/WorkflowyToNeo4j
The project consists of a Docker docker-compose file to spin up Neo4j locally, and also a LINQPad script which processes a Workflowy exported text file, writing the data to Neo4j.
The readme file in my GitHub project gives step by step instructions on how to use it, so I won't repeat that here. Instead, just enjoy this animated gif of the results! ...

Note that the Workflowy data in the animated gif is pinched from Workflowy's Live Demo, as I want to keep my own personal Workflowy data, well, personal. It's much more fun though when you're browsing your own data - so if you're a Workflowy user, I'd highly recommend having a play and using my code to export your own data into a local Neo4j instance.
Obviously, Workflowy data is just one example idea I had. What other data sources can you think of that would be awesome dumped into Neo4j? The obvious one for this shape of data is social media, where a node is a user and the relationships points to other users that they're following. A social network is the perfect example of what this kind of database is ideal for, but there's plenty more! Your hard-drive directory structure perhaps? I'd love to hear any other random ideas, so do please comment below with your weird and wonderful use-cases! ...
Comments